
- Jun 09 Sun 2019 18:09
-
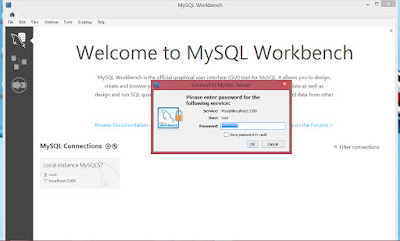
啟動MySQL Workbench與建立Database 和 Table
- Jun 09 Sun 2019 17:25
-
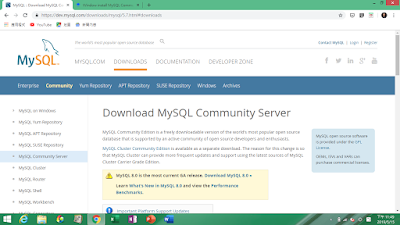
在Windows上安裝MySQL Community Server
- May 25 Sat 2019 17:00
-
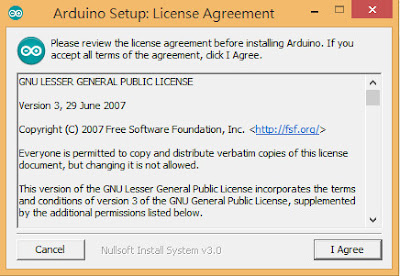
在Arduino IDE安裝ESP32 Add-On
- May 25 Sat 2019 13:06
-
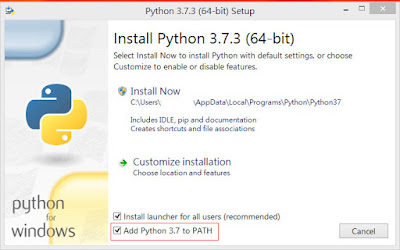
Windows下安裝Python、virtualenv與 Django
- May 25 Sat 2019 12:27
-
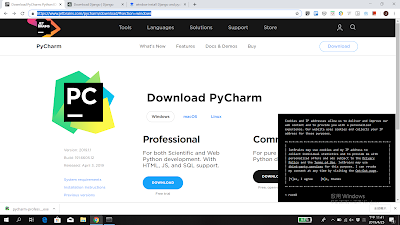
Windows下安裝Pycharm與新增Django專案
- Mar 01 Fri 2019 13:09
-
[Python] 好用的Python編輯器-Google Colaboratory與Jupyter Notebook線上版

[若不想看pixnet的廣告,請到: https://labview-tech.blogspot.com/2019/02/python-google-colaboratory.html]
作為一個想學Python的初學者,想使用簡單可以花最少時間學習的介面,我發現Jupyter Notebook是不錯的工具,一般Jupyter Notebook是要安裝在電腦上,會需要經過一些設定的程序,但也有線上版本(如: https://jupyter.org/try)。
可以選Try Jupyter with Python試看看Jupyter Notebok的功能,
寫幾行程式試試用Python畫圖的功能,
- Mar 01 Fri 2019 13:04
-
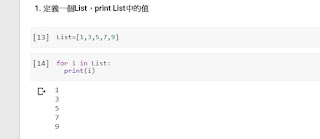
[Python] For Loop 迴圈練習
[若不想看pixnet廣告,請到此連結: https://labview-tech.blogspot.com/2019/02/python-for-loop.html ]
For Loop練習,使用Google colaboratory。
1. 定義一個List,print List中的值
- Mar 01 Fri 2019 12:54
-
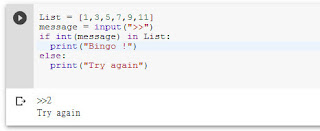
[Python] IF條件判斷
[若不想看Pixnet的廣告,請看: https://labview-tech.blogspot.com/2019/03/python-if.html]
這邊來做幾個Python IF條件的判斷練習
1. if 判斷條件:
- Mar 03 Sat 2018 11:38
-
使用BLE Dongle (BLED112)與LabVIEW BLE Toolkt遭遇的問題
目前想使用BLED112與LabVIEW BLE Toolkit與BLE M+Arduino作結合,想Read與Write資料,
雖然這個BLE Module與App Inventor 2的資料讀寫,已經證實可行,
但在與BLED112與LabVIEW BLE Toolkit的搭配上卻還有這一些問題,
首先是Characteristic UUID與Service UUID無法被發現:
Error 0 occurred at Client Characteristic Configuration for Service: 0000FFF0-0000-1000-8000-00805f9b34fb and Characteristic 0000FFF1-0000-1000-8000-00805f9b34fb was not found
- Jan 21 Sun 2018 07:05
-
(下) BLE (Bluetooth Low Energy) Toolkit for LabVIEW (低功耗藍芽工具套件)
- Jan 13 Sat 2018 13:15
-
(上) BLE (Bluetooth Low Energy) Toolkit for LabVIEW (低功耗藍芽工具套件)
- Oct 29 Sun 2017 18:41
-
[未完] UX自學資訊